Segmenting cell nuclei with the stardist napari plugin#
Plugins are a way of extending Napari’s functionality beyond the basic viewer. Many plugins are available for common analysis tasks such as segmentation and filtering. In this activity, we will segment nuclei using the stardist napari plugin. Please visit the napari hub for a list of all available plugins.
Cell nuclei detection#
StarDist is a deep-learning based Python library used for segmenting star-convex objects, such as cell nuclei, in 2D and 3D images. It is also available as plugins for ImageJ, Napari, and Qupath.
In this notebook, we will use StarDist to detect cell nuclei in an image extracted from the DeepSlides public dataset of histopathology images.
Setup#
Check that you have all the necessary packages installed, including napari and the stardist-napari plugin. If not, you can use the ! symbol to install them directly from the Jupyter notebook (otherwise, you can use your terminal).
Note
Napari plugins are Python packages, so you can install them using pip (e.g. pip install stardist-napari)
import napari
from stardist.models import StarDist2D
Get the data#
The image we’ll use in this tutorial is available for download on Zenodo (deepslide.png).
In the cell below, we use a Python package called pooch to automatically download the image from Zenodo into the data folder of this repository.
import pooch
from pathlib import Path

data_path = Path('.').resolve().parent / 'data'
fname = 'deepslide.png'

pooch.retrieve(
    url="https://zenodo.org/record/8099852/files/deepslide.png",
    known_hash="md5:67d2dac6f327e2d3749252d46799861a",
    path=data_path,
    fname=fname,
    progressbar=True,
)

print(f'Downloaded image {fname} into: {data_path}')
Read the image#
We use the imread function from Scikit-image to read our PNG image.
from skimage.io import imread

image = imread(data_path / 'deepslide.png')

print(f'Loaded image in an array of shape: {image.shape} and data type {image.dtype}')
print(f'Intensity range: [{image.min()} - {image.max()}]')
If you run into troubles, don’t hesitate to ask for help 🤚🏽.
Load the image into Napari#
Let’s open a viewer and load our image to have a look at it.
viewer = napari.Viewer()
viewer.add_image(image, name="H&E (DeepSlides)")
Intensity normalization#
Let’s rescale our image to the range 0-1. By doing so, it is also converted to an array of data type float.
from skimage.exposure import rescale_intensity

image_normed = rescale_intensity(image, out_range=(0, 1))

print(f'Intensity range: [{image_normed.min()} - {image_normed.max()}]')
print(f'Array type: {image_normed.dtype}')
Instantiate a StarDist model#
The StarDist developers provide a few pre-trained models that may already be applied to suitable images.
Here, we will use the Versatile (H&E nuclei) model that was trained on images from the MoNuSeg 2018 training data and the TNBC dataset from Naylor et al. (2018).
model = StarDist2D.from_pretrained("2D_versatile_he")

model
Run the model#
We use the predict_instances method of the model to generate a segmenation mask (labels) and a representation of the cell nuclei as polygons (polys).
labels, polys = model.predict_instances(
    image_normed,  # The image must be normalized
    axes="YXC",
    prob_thresh=0.5,  # Detection probability threshold
    nms_thresh=0.1,  # Remove detections overlapping by more than this threshold
    scale=1,  # Higher values are suitable for lower resolution data
    return_labels=True,
)

# We also get detection probabilities:
probabilities = list(polys["prob"])

n_detections = len(probabilities)

print(f'{n_detections} cells detected.')
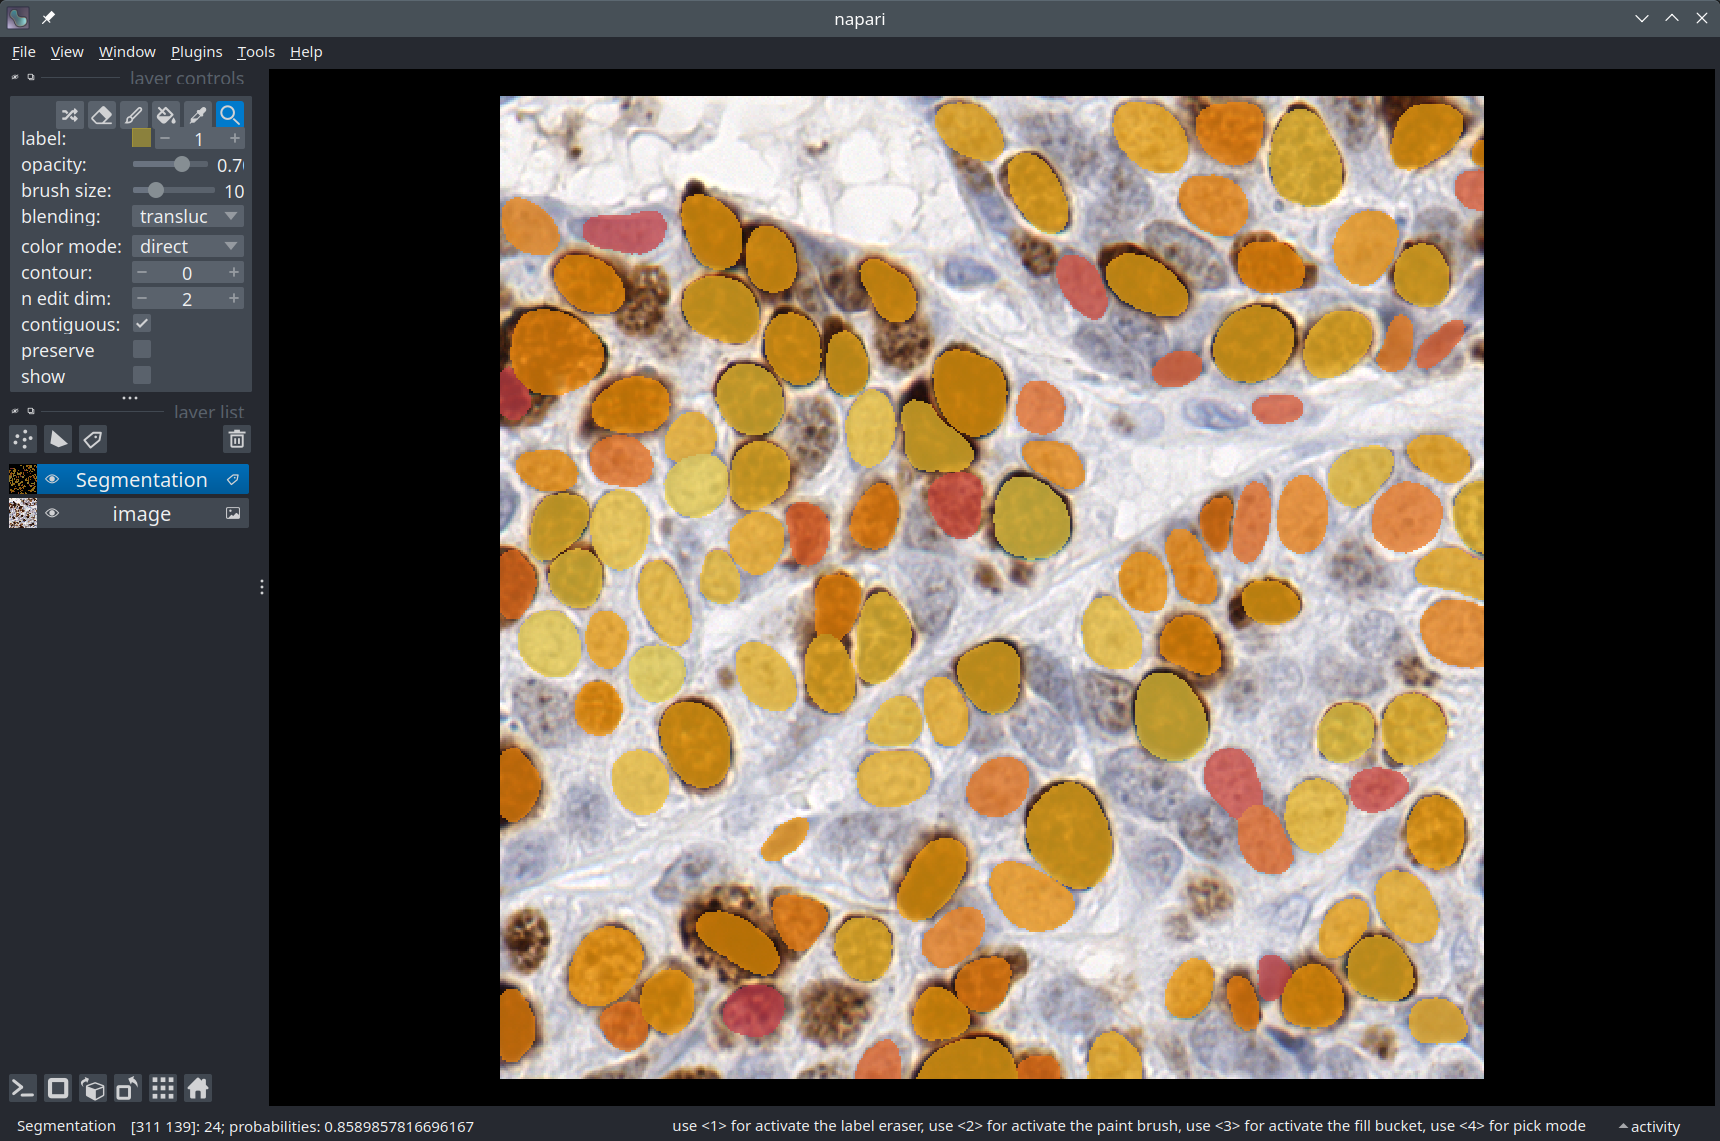
Visualization in Napari#
We use a Napari Labels layer to display the segmentation overlaid on the image.
import numpy as np
import matplotlib.pyplot as plt

# Create a custom color lookup table based on detection probabilities
probas_incl_bg = np.zeros(n_detections + 1)  # Include a value for the background
probas_incl_bg[1:] = probabilities

colors = plt.cm.get_cmap('inferno')(probas_incl_bg)  # Convert probability values to colors
colors[0, -1] = 0.0  # Make the background transparent (alpha channel = 0)
colormap = dict(zip(np.arange(len(probas_incl_bg)), colors))

labels_layer = viewer.add_labels(
    labels,
    name='Segmentation',
    color=colormap,
    properties={'probabilities': probas_incl_bg},
    opacity=0.7
)

# In Napari, you can display some text in the top-left part of the window, for example:
viewer.text_overlay.visible = True
viewer.text_overlay.text = f'Number of detections: {n_detections}'
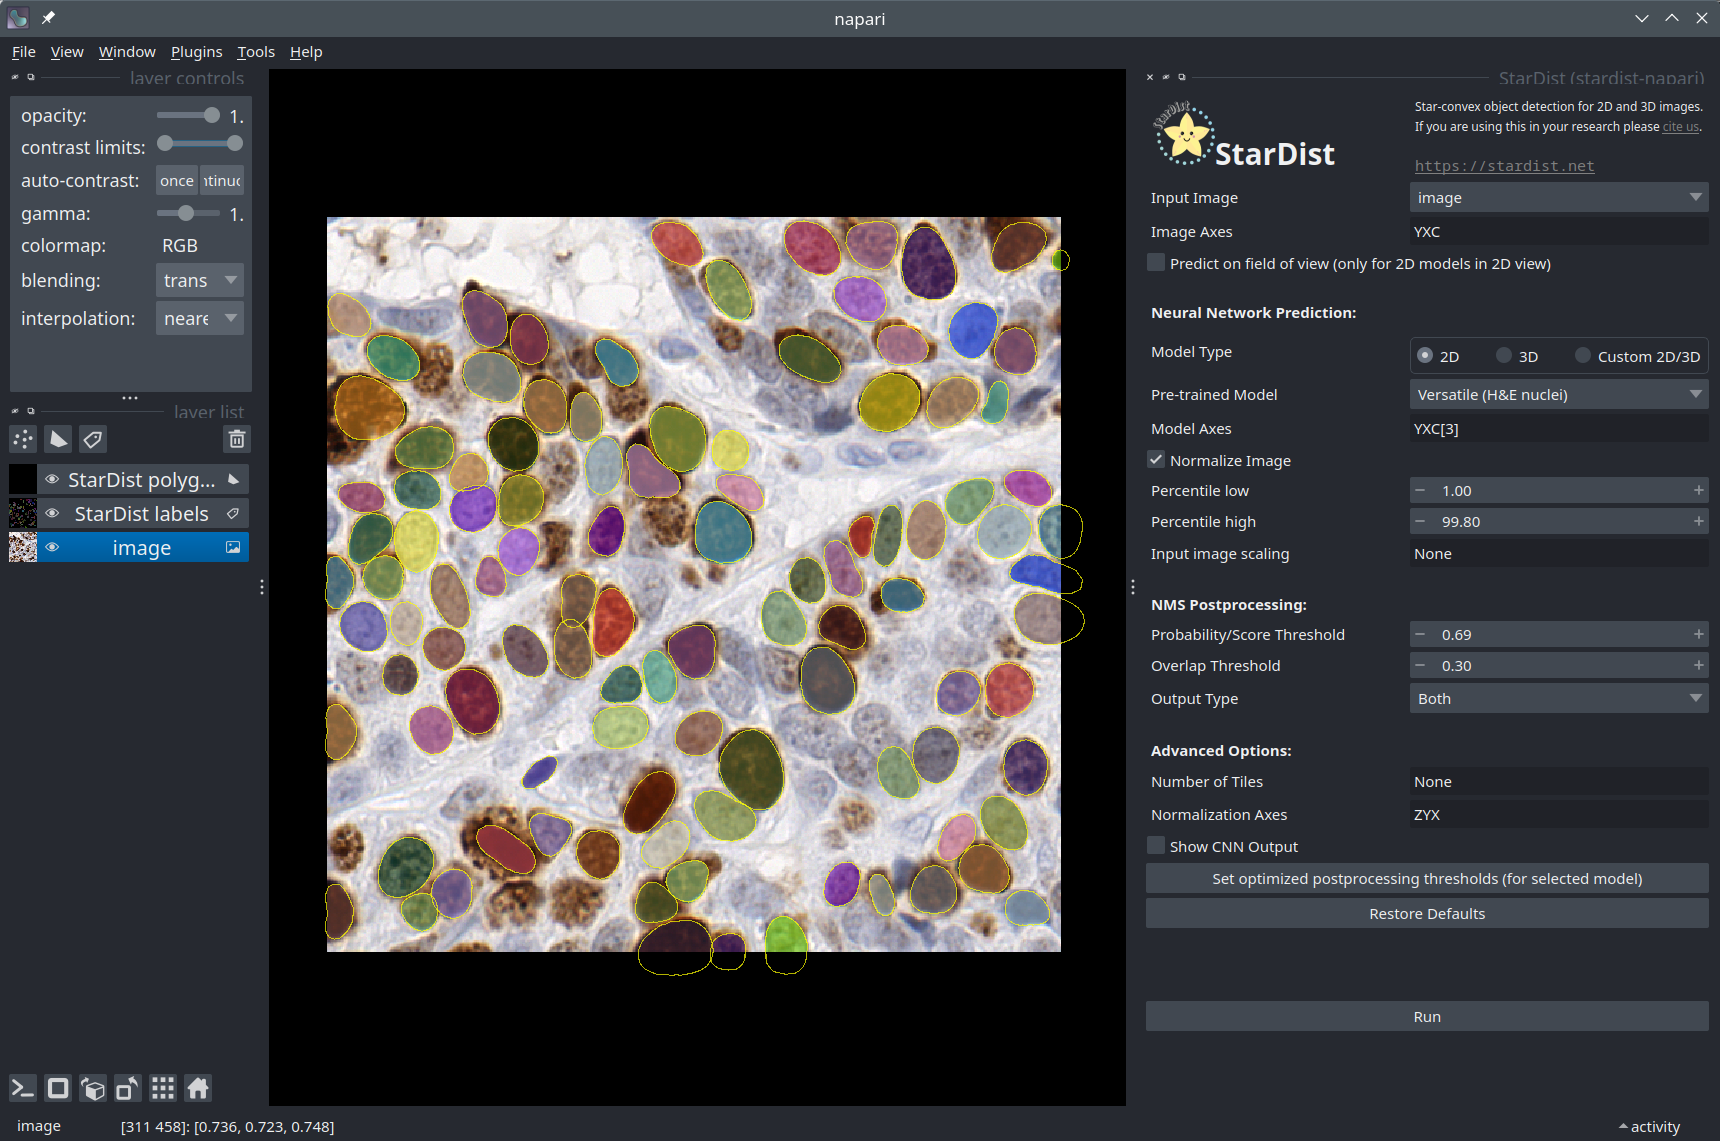
The stardist-napari plugin#
So far in this notebook, we have only used the StarDist Python package. As it turns out, a Napari plugin for StarDist also exists. If you have installed it using pip, you should be able to find it in the Plugins menu of Napari. In case you have any doubts, you can follow the instructions below to make sure you are using the plugin correctly.
Select the Deepslides image layer.
Set the model type to “2D”.
Select the “Versatile (H&E nuclei)” pretrained model.
Check the “Normalize Image” checkbox.
You can leave the postprocessing options as their default values. You can also try different values for the “Probability Threshold” and observe how it affects the number of objects detected.
When the segmentation is complete, you should see that two layers have been added to the viewer. The StarDist polygons contains the outlines of the segmented cells as a
Shapeslayer. The StarDist labels contains the instance segmentation as aLabelslayer.
You can check that the nuclei segmentation produced by the plugin is similar to what you got by running the model previously in this notebook!
Note
It may take a while for the StarDist plugin to first open, as it downloads some pre-trained models for you.
Conclusions#
In this notebook, we have used StarDist to segment cell nuclei in an image from the DeepSlides dataset. We have seen that StarDist can be run directly from Python or from the stardist-napari plugin.