Image data visualization with Python and Napari#
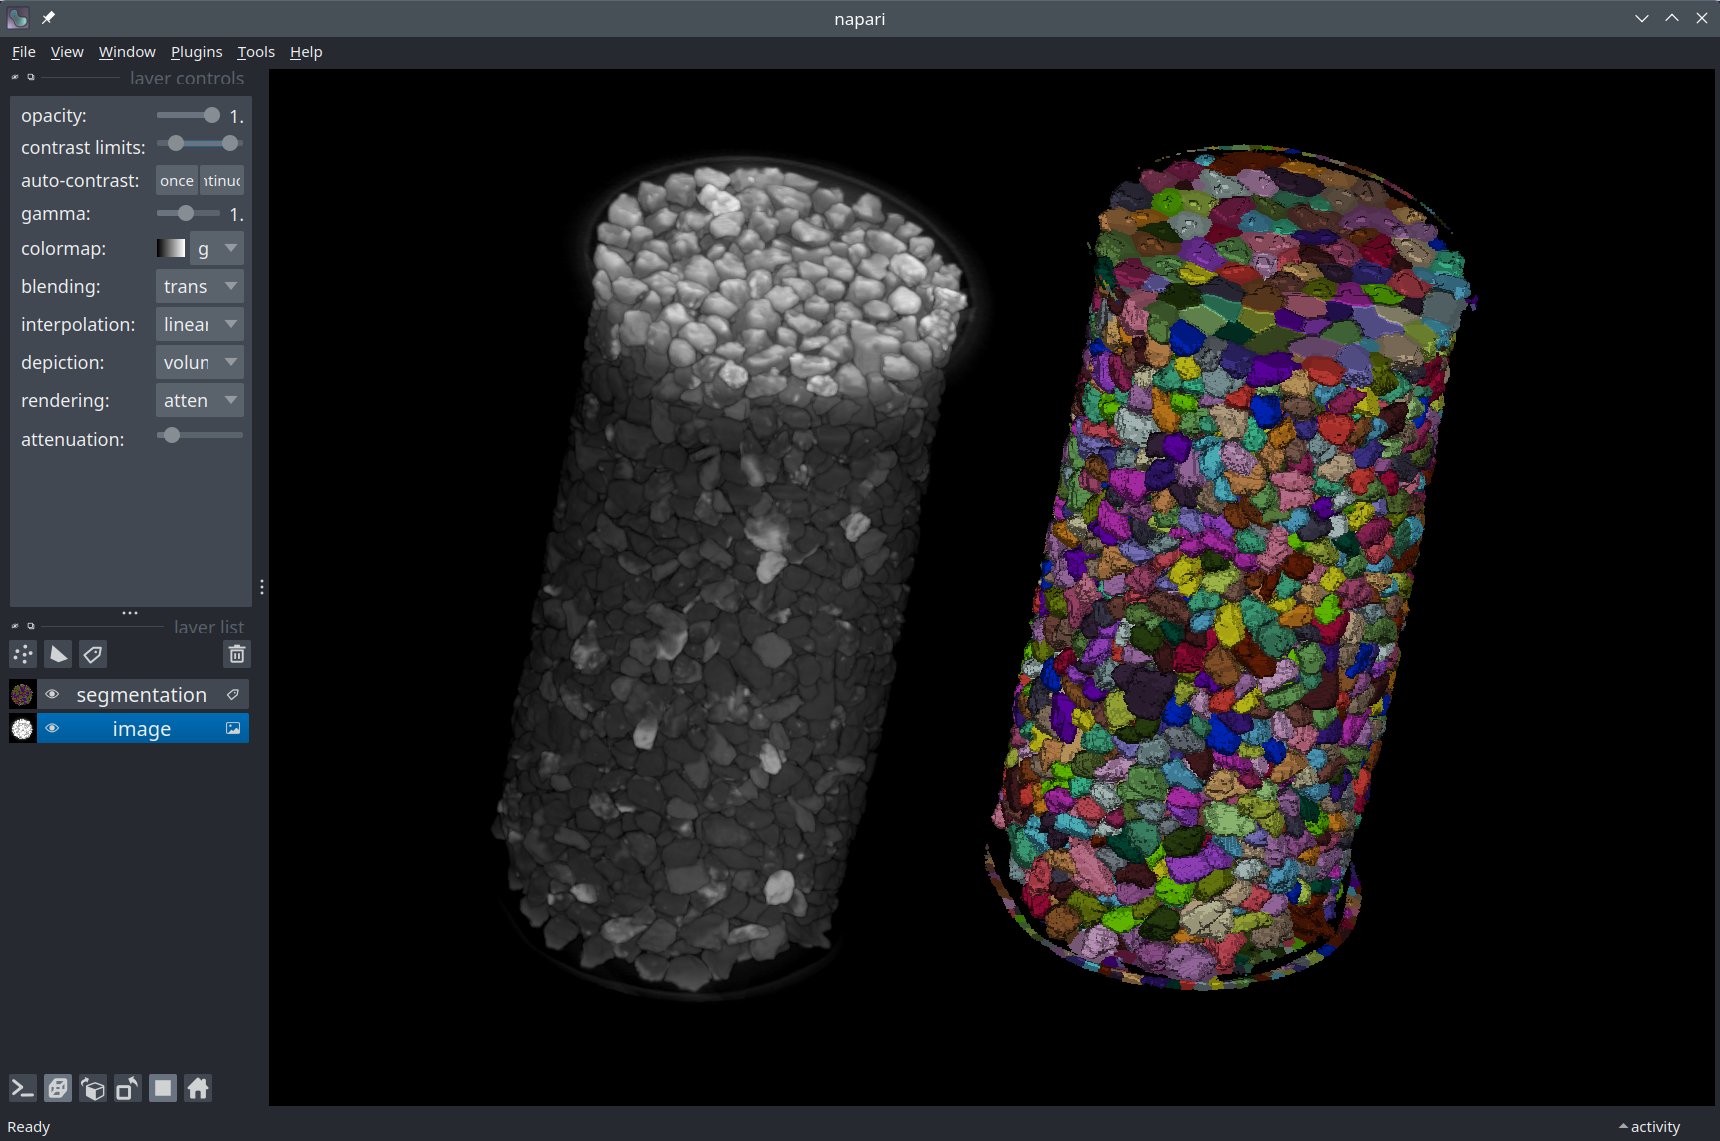
Napari is a multi-dimensional image viewer for Python. It is used to visualize scientific images and the data associated with them, such as segmentation masks, bounding boxes, and keypoints, for example. With Napari, you can
visualize timeseries, 2D, 3D, and multi-channel images.
create interactive visualizations tailored to your needs.
set up visualizations in a Python script or a Jupyter notebook.
annotate data (draw segmentation masks, polygons, etc.).
use plugins from the community or develop and share your own plugin.
Click on the links below to learn more about Napari.


Next steps#
Have a look at our Napari Q&A page which will answer some questions you may have about Napari.
Start using Napari by installing it and downloading this workshop material.
Have a look at our notebook case studies to understand what is possible to do with Napari.
🎉 Happy visualization!