Manual annotation of triangular crystallites#
Note
This is an advanced example!
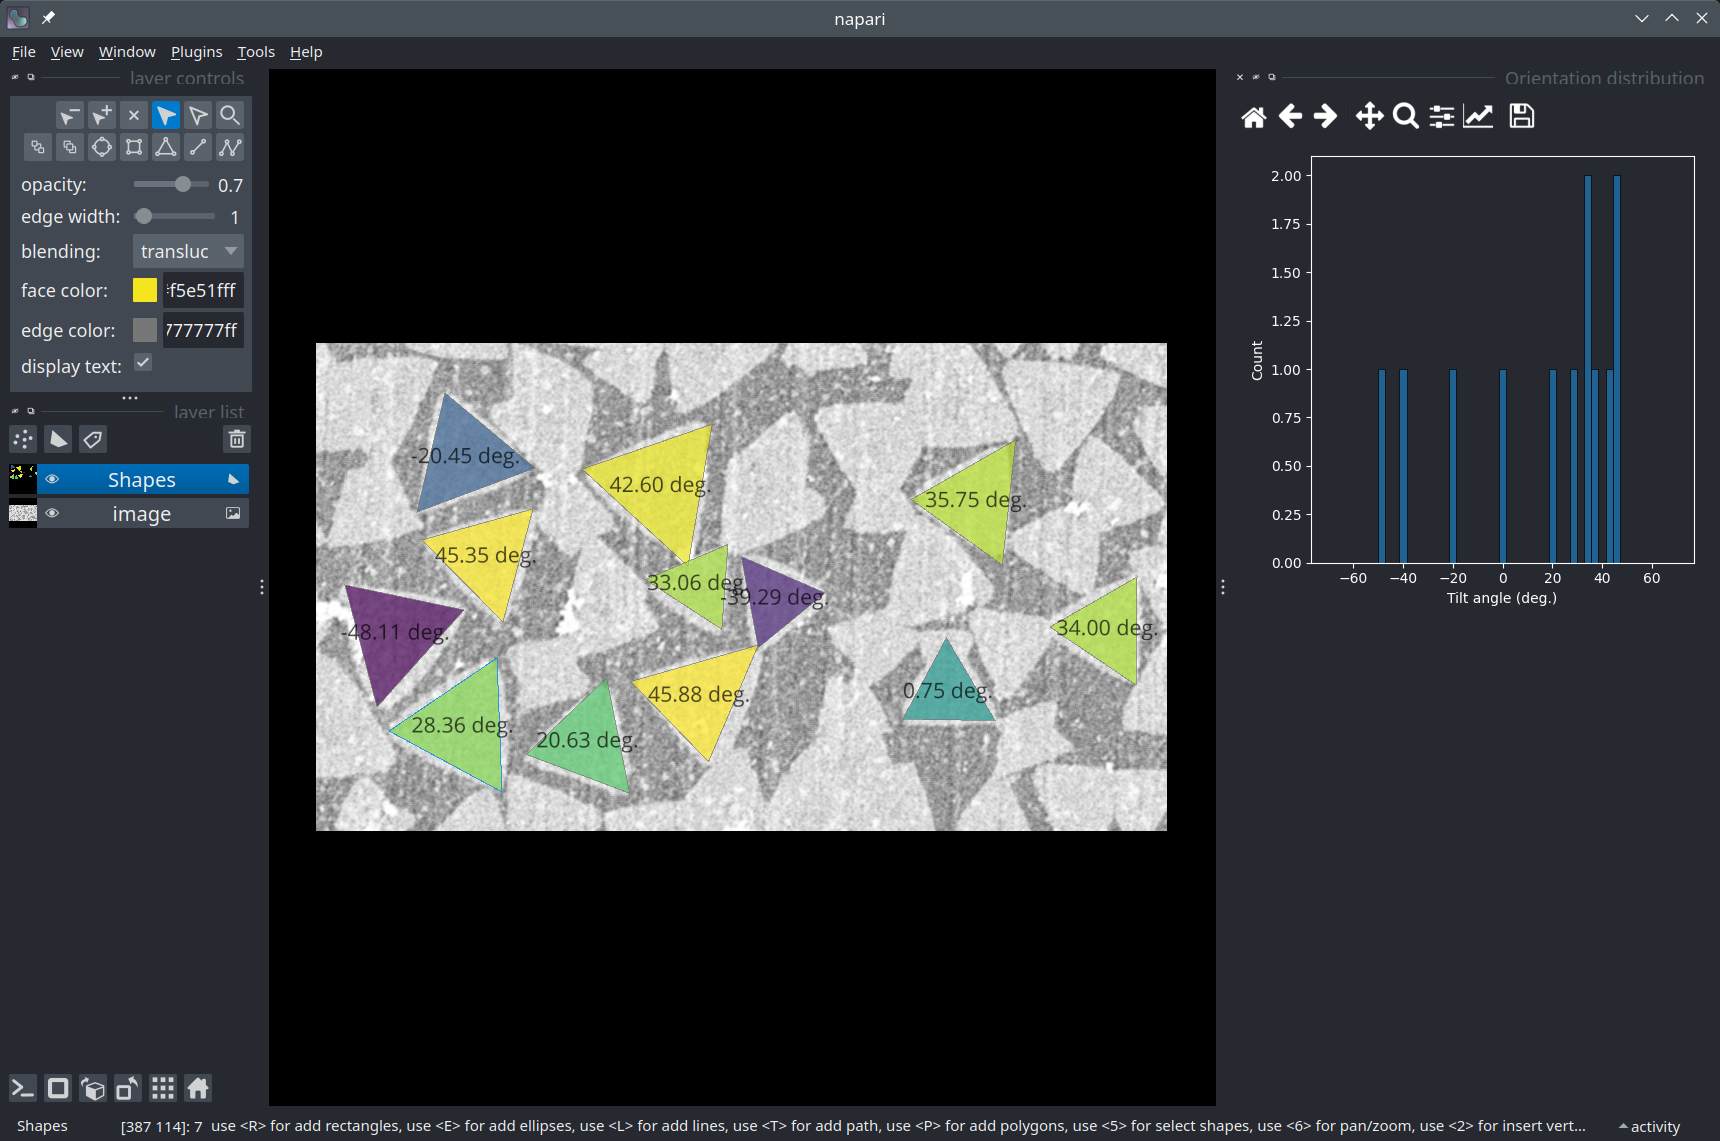
In this notebook, we will explore some of the interactive capabilities of Napari. We will use the napari-matplotlib plugin to integrate a histogram plot into the viewer and update it as the user draws polygons in a Shapes layer. The histogram represents the tilt angle of the crystallites (triangles) with respect to the horizontal axis of the image.
Acknowledgements
We kindly acknowledge the Laboratory of Advanced Separations in EPFL for providing the data for this notebook!
Setup#
Check that you have all the necessary packages installed, including napari, the napari-matplotlib plugin, and seaborn. If not, you can use the ! symbol to install them directly from the Jupyter notebook (otherwise, you can use your terminal).
import napari
Get the data#
The image we’ll use in this tutorial is available for download on Zenodo (crystallites.tif).
In the cell below, we use a Python package called pooch to automatically download the image from Zenodo into the data folder of this repository.
import pooch
from pathlib import Path

data_path = Path('.').resolve().parent / 'data'
fname = 'crystallites.tif'

pooch.retrieve(
    url="https://zenodo.org/record/8099852/files/crystallites.tif",
    known_hash="md5:18d619a8f70114f2e5437e4713e45166",
    path=data_path,
    fname=fname,
    progressbar=True,
)

print(f'Downloaded image {fname} into: {data_path}')
Read the image#
We use the imread function from Scikit-image to read our TIF image.
from skimage.io import imread

image = imread(data_path / 'crystallites.tif')

print(f'Loaded image in an array of shape: {image.shape} and data type {image.dtype}')
print(f'Intensity range: [{image.min()} - {image.max()}]')
Load the image into Napari#
Let’s open a viewer and load our image to have a look at it.
viewer = napari.Viewer()
viewer.add_image(image)
Set up custom UI interactions#
First, we create a class AngleHistogramWidget that inherits from the base class NapariMPLWidget from the napari-matplotlib plugin to define the kind of plot to draw. The code can be templated and reused to display any kind of plot compatible with matplotlib.
Here, for example, we display a Seaborn histplot in the interface.
from qtpy.QtCore import Qt
from qtpy.QtWidgets import QWidget, QSizePolicy, QVBoxLayout
from matplotlib.backends.backend_qt5agg import FigureCanvas
import numpy as np
import seaborn as sns

class AngleHistogramWidget(QWidget):
    """
    Displays a histogram of the 'angle' property of the currently selected Napari `Shapes` layer.
    """
    def __init__(self, napari_viewer):
        super().__init__()
        self.viewer = napari_viewer

        grid_layout = QVBoxLayout()
        grid_layout.setAlignment(Qt.AlignTop)
        self.setLayout(grid_layout)

        self.canvas = FigureCanvas()

        self.canvas.figure.set_tight_layout(True)
        self.canvas.figure.set_size_inches(6.0, 6.0)
        self.canvas.figure.patch.set_facecolor("#cddced")

        self.axes = self.canvas.figure.subplots()
        self.axes.set_xlabel('Tilt angle (deg.)')
        self.axes.set_ylabel('Count')

        self.canvas.setSizePolicy(QSizePolicy.Minimum, QSizePolicy.Minimum)
        self.canvas.setMinimumSize(200, 200)
        grid_layout.addWidget(self.canvas)

    def _plot_histogram(self, layer):
        if not 'angle' in list(layer.properties.keys()):
            return

        self.axes.clear()
        self.axes.set_xlabel('Tilt angle (deg.)')
        self.axes.set_ylabel('Count')

        # The seaborn histplot looks for data in the 'angle' property of the layer.
        sns.histplot(layer.properties['angle'], bins=np.linspace(-70, 70, 50), ax=self.axes)

        self.canvas.draw()

# Create and dock the Histogram widget element
histo_widget = AngleHistogramWidget(viewer)
viewer.window.add_dock_widget(histo_widget, name='Orientation distribution');
Next, we define a callback function on_set_data that we connect to the event set_data of the Napari Shapes layer used for annotating the crystallites. In this way, we can update the text to display in the layer dynamically as the user draws new polygons. Similarly, we connect the mouse_double_click callback of the layer to the method _draw of the AngleHistogramWidget so that the histogram gets updated when the user finishes drawing a polygon.
If you’re interested in setting up custom interactions for your own project, you can check the Events reference and this tutorial.
import pandas as pd
from napari.utils.events import Event

def on_set_data(event: Event):
    """Called when the data in the `Shapes` annotation layer changes."""
    shapes_layer = event.source
    shapes_data = shapes_layer.data

    if len(shapes_data) == 0:
        return

    angles = []
    for polygon in shapes_data:
        triangle = pd.DataFrame.from_dict({'y': polygon[:, 0], 'x': polygon[:, 1]})
        if len(triangle) < 3:
            tilt_angle_degrees = 0.0
        else:
            # Sort the corners by Y coordinate
            triangle.sort_values(by='y', inplace=True)

            # Select the two corner points opposite to the lowest corner, sort them by X coordinate
            points_opposite = triangle.iloc[1:].sort_values(by='x')

            # Compute the deltas (dX, dY)
            deltas = points_opposite[['x', 'y']].diff().iloc[1]

            # Avoid dividing by zero if dX is zero
            if deltas['x'] == 0:
                tilt_angle_degrees = 0.0
            else:
                tilt_angle_radians = np.arctan(deltas['y'] / deltas['x'])
                tilt_angle_degrees = np.degrees(tilt_angle_radians)

        angles.append(tilt_angle_degrees)

    shapes_layer.properties = {'angle': angles}
    shapes_layer.text={
        'string': '{angle:.2f} deg.',
        'size': 16,
        'color': 'black',
    }
    shapes_layer.face_color='angle'


# Add a `Shapes` layer in which to draw the polygons
shapes_layer = viewer.add_shapes(data=None, name='Annotations', shape_type='polygon')

# Call `on_set_data` when the user sets data into the `Shapes` layer
shapes_layer.events.set_data.connect(on_set_data)

# Update the histogram on double-click (to finish drawing a polygon)
shapes_layer.mouse_double_click_callbacks.append(lambda layer, event: histo_widget._plot_histogram(layer))
Usage#
Select the
Annotationslayer by clicking on itDraw polygons on the triangular crystallites (shortcut:
P)double left-clickto finish drawing a polygon and move to the next!
Conclusion#
In this notebook, we have seen how Napari’s interface could be extended using the Qt framework to enable a highly customized annotation task. It is even possible to integrate interactive plots directly into the viewer’s interface.